Solar installation costs continue to come down.
Since 2010, the cost of installing solar has dropped an incredible 65%.
While buying a solar installation might’ve been only for the well-to-do just a decade ago, with today’s low prices (and great financing options) anyone can install solar and save some money on their energy bills.
The best way to calculate the true cost of your solar panel panels with installation, and how much you could save on electricity, is to get a free estimate.
New lows for solar installation costs in 2021
Every year, the solar industry makes the headlines with lower installation prices. The latest jaw-dropper was from the once-great SolarCity (now Tesla), which announced early this year that it would charge just $2.50 per watt for solar installations – a record low. With the 30% federal tax credit, that put solar installation costs at just $1.75 per watt.
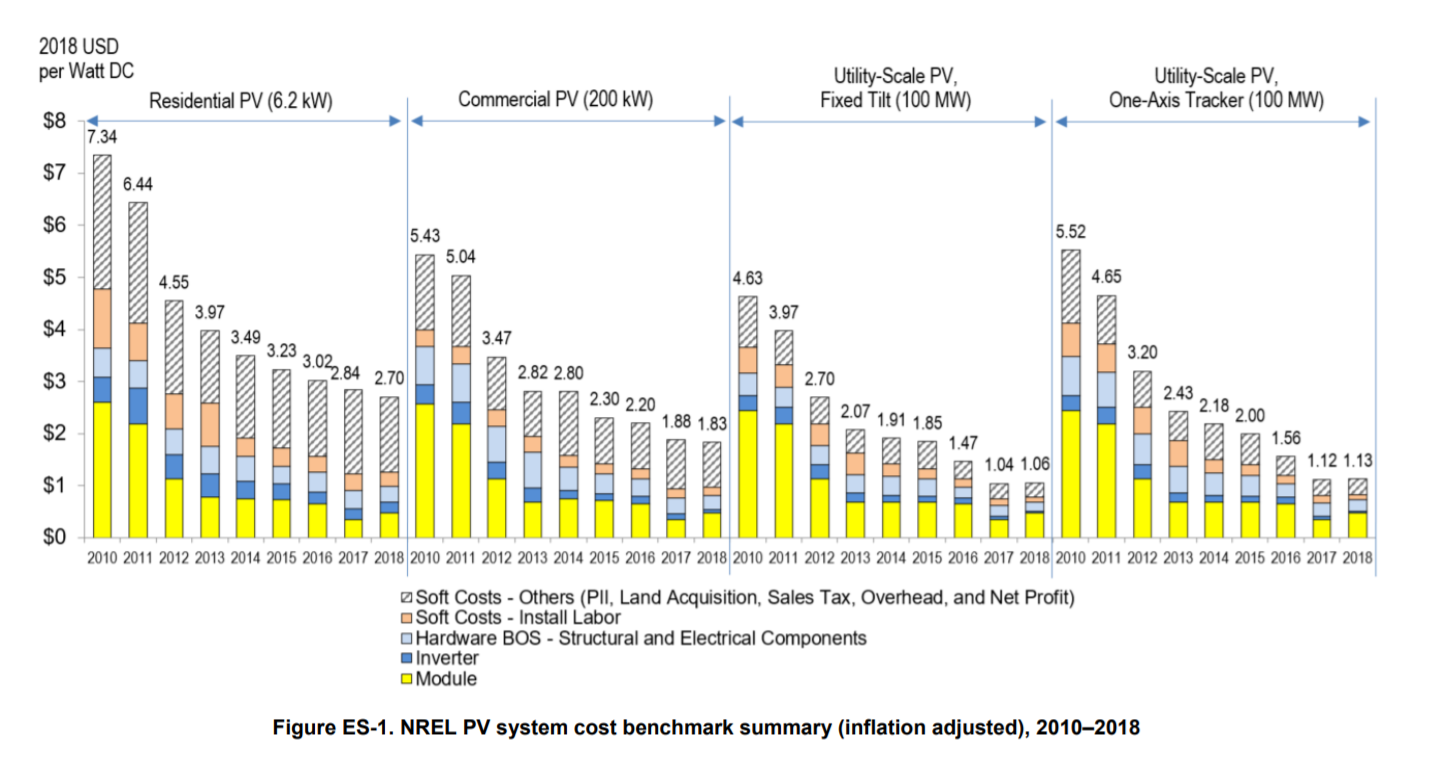
In 2010, the average home solar installation cost was $7.34 per watt. So while Tesla charges just $20,000 for an 8 kilowatt installation, that same installation in 2010 would’ve cost $58,720!
Of course, since 2010 installation costs have steadily fallen each year. Colorado’s National Renewable Energy Lab actually publishes data every year on solar installation costs, the latest being the Q1 2018 Solar PV System Cost Benchmark. As can be seen in the chart below, NREL estimates that the average installation price in 2018 was just $2.70 per watt. That’s a 65% drop in price in just 8 years.
Tesla’s installation cost of $2.50 per watt is certainly headline-grabbing, but most installers aren’t quite there yet and, in reality, solar installation costs can go all the way up to $3 per watt. A $0.50 difference probably doesn’t sound like a lot, but for an 8kW installation that’s an extra $4,000 you’ll have to shell out.
What drives solar energy’s falling costs?
If you look at the chart above, you can see the single biggest driver to solar energy’s falling cost is the rapidly-falling cost of the solar panels themselves, thanks largely to economies of scale in manufacturing and cheap imports. In 2010, the solar panels (or modules) made up about 35% of total installation costs. Today, those same panels make up just 15% of installation costs.
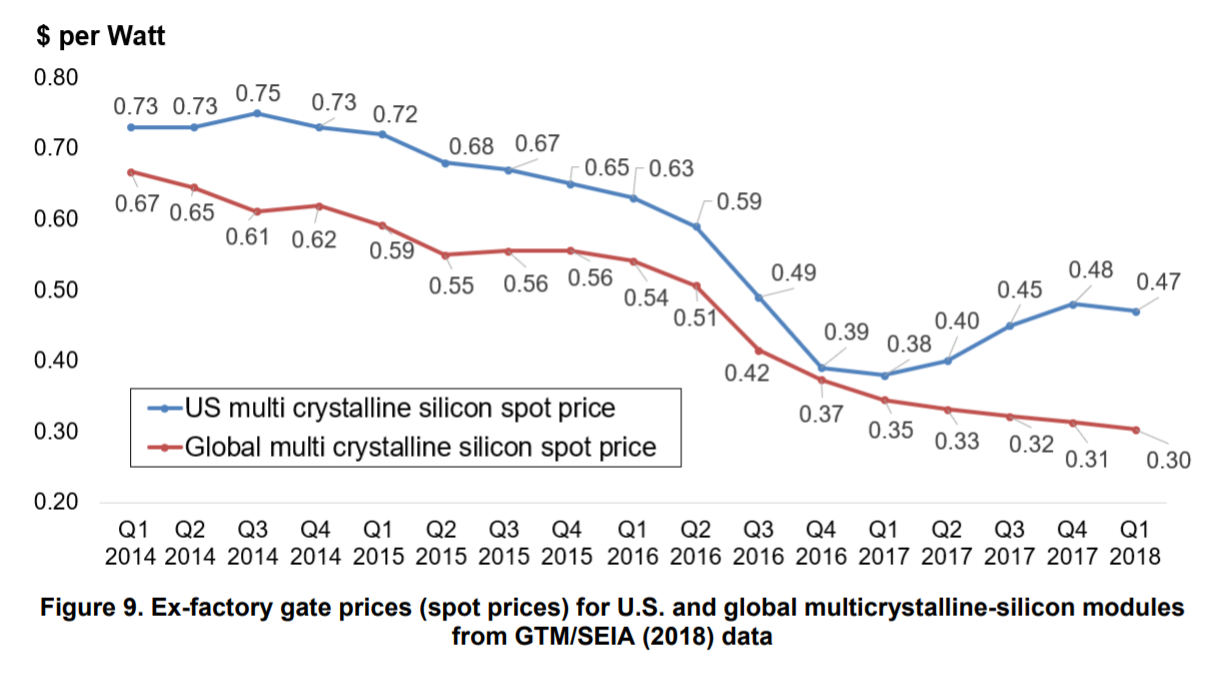
In 2010, solar panels cost about $2.50 per watt, but by early 2017 that had fallen to just $0.38 per watt. Panel prices increased about 20% in early 2018 – about the same time that the US took steps to implement tariffs on imported solar panels – but since then have resumed their downward trajectory.
The solar industry even has its own name – Swanson’s Law – for the falling price of solar panels. Popularized in a 2012 article in The Economist, Swanson’s Law states that solar panel prices tend to decrease by 20% for every doubling of worldwide panel shipments. In the real world, this works out to about a 10% cost decrease each year.
Exactly how long these falling prices will continue is anyone’s guess, but experts think it might end pretty soon. The cost of solar panels has fallen just 2.3% in 2019 and Forbes foresees panel prices as bottoming out soon, as the Chinese market stabilizes.
Solar industry analysis firm GTM also predicts residential solar installation costs to bottom out around $2.50 per watt – a number that Tesla has already attained and other installers are likely trying to figure out as well. If the industry wants to continue this downward-trending cost we’ve all come to expect, installers will need to place greater focus on lowering operating and installation costs, streamlining the installation process and working towards reducing the often dreadfully-high permitting fees.
How tax credits and incentives work
When rooftop solar was still in its infancy in the 2000s, the federal government and numerous states and cities saw the benefits of renewable energy – namely the financial savings and low emissions – and decided to help the industry out by offering tax credits, rebates, or other financial incentives. These incentives were designed to make solar attainable for more homeowners, thereby boosting the nascent solar industry, and most were set to gradually expire as solar became close to the cost of utility prices.
In 2019, many of these incentives have already expired, but there are a few great ones still lurking around.
The federal 30% tax credit, known as the Investment Tax Credit (ITC), is the largest solar incentive available right now. This credit allows you to write off 30% of your total solar installation cost on your federal income tax.
If you paid $16,000 for your installation, for example, you could claim a $4,800 credit when you file your taxes. As a credit – not a deduction – the ITC is a dollar-for-dollar discount on your installation. However, as a non-refundable credit, it can only bring your tax burden down to $0; the federal government will not give you a refund based on this credit alone. You can break the credit into chunks and claim it over several years though.
2019 was the last year for the full 30% credit. At the beginning of 2020, the tax credit dropped to 26%. In 2021, it dropped further to 22%, then 10% in 2022. After that, it’s toast!
The federal tax credit isn’t the only incentive to help bring down your solar expenses. Cities and states across the US also offer incentives for solar. Colorado Springs Utilities, for example, offers rebates of $0.20 per watt for residential solar. The City of San Francisco offers $200 to $500 per kW, depending on system size.
Other cities and states offer property or sales tax exemptions for solar equipment and installation costs while others offer income tax credits similar to the ITC. Your solar installer will be intimately familiar with all available incentives in your area, so be sure to ask for a rundown of what incentives are out there.
Solar is growing fast, but still a fraction of overall generation
Solar and renewable energy has exploded in the last twenty years, but it’s still just a small fraction of total electricity generation in the US.
In 2009, utilities in the US produced just 28 gigawatt-hours (GWh) of solar electricity, but by 2018 that number had increased to 5,252 GWh. That’s an increase of 19,000%!
In that same period, the bottom fell out on coal as well. In 2009, coal produced 1.3 million GWh of electricity – far larger than any other fuel type. By 2018, that had dropped 35% to about 860,000 GWh.
Its fall from grace was, and continues to be, pretty striking. However, coal is still a huge part of our electricity industry. Even in 2019, coal still accounts for about a third of our total electricity generation, while solar makes up just 0.28%, according to data from the EIA.
When looking at renewable energy more generally, the outlook is a bit better, as both wind and hydroelectricity power huge swaths of the country. In 2019, renewable energy in all its forms accounts for about 15% of total electricity generation. For the first time in history, renewable energy (including hydro) actually outperformed coal in April and May of 2019 and renewables are set to permanently overtake coal by 2031, according to the EIA, driven by falling prices.
While solar has exploded over the last decade, we’re certainly not going to fix the earth with 2/3 of our electricity still coming from fossil fuels. Many states and cities are taking steps to push renewable and clean energy as far as it will go. Hawaii, California, New Mexico, and Washington have all pledged to go 100% clean or renewable energy within the next few decades, so get ready to sell a lot more solar and wind.
Is solar at cost parity with the utility?
This is the big question the solar industry is always asking. Is installing solar cheaper than purchasing electricity from the utility?
This idea, known as grid parity, is what the entire solar industry is working towards. Once it’s cheaper to purchase and install a solar system on your roof than to continue purchasing electricity, all without any financial incentives, then there’s nothing to keep rooftop solar from taking over the world.
As of 2019, residential rooftop solar is cost-competitive with utilities in many areas of the US, but not all.
First off, the good news: Large-scale solar (those owned by utilities) not only has achieved parity with the cost of conventional fuels, but is actually cheaper. Each year, consulting firm Lazard analyzes the life-cycle cost (what they call Levelized Cost of Energy, which includes facility construction, maintenance, and fuel costs) of electricity sources.
In 2018, it found that unsubsidized utility-scale solar costs $36 per MWh, while natural gas cost $41 per MWh and coal $60 per MWh. When adding in incentives like the federal tax credit, the cost of utility-scale solar drops further to just $32 per MWh. Utilities are even finding solar more financially attractive than continuing to run existing coal plants. Across the country, utilities are closing coal plants early, in favor of cheaper, cleaner renewables or natural gas. Xcel Energy, for example, announced in May 2019 that it has decided to close two coal plants in Minnesota by 2030, in favor of energy efficiency measures and new wind power.
From a homeowner’s perspective, it’s a bit of a different story. In the same analysis, Lazard estimates that – after incentives – residential rooftop solar costs about $0.15 to $0.25 per kWh. At $0.15 per kWh, that’s generally at grid parity in about ten states in the US, mostly in the west, northeast, and Hawaii.
In reality, solar can be competitive with utility rates outside these ten states. As an example, let’s say we installed a medium-sized 6kW solar installation in Colorado. At $3.00 per watt, that’s a total investment of $18,000.
A well-placed 6kW installation in Denver will produce about 9,622 kWh per year and about 218,800 kWh over its 25-year lifespan, after taking into account production losses each year due to wear and tear on the panels.
Breaking down your initial cost ($18,000) by total production, your solar electricity would cost about $0.08 per kWh. Not bad considering the average residential utility rate in Colorado is $0.12 per kWh.
Solar electricity is well below grid parity in states with high utility rates like California, Hawaii, and New York. In fact, it’s the reason why solar is so popular among homeowners in those states. In other states like Colorado, it typically makes sense, as long as your installation costs aren’t sky-high. In states with low utility rates, like Idaho or Washington (both of which have low utility rates thanks to cheap hydroelectric power), the financial value of solar needs to be calculated on a case-by-case basis.
How much can I save going solar?
In our example above, we found a Colorado homeowner can save about $23k by installing solar on their home. However, those lifetime savings can range from just $5,000 to more than $40,000.
Why such a wide range? The amount you save by installing solar depends on a wide variety of factors, including: 1) your cost to install, 2) your solar installation’s electricity production, 3) the utility rates in your area, and 4) your financing.
If that’s enough of an explanation for you, feel free to skip to the next section. If you want to learn a bit more about how all these factors affect your financial savings, keep reading! Let’s take a look at each one a bit more in-depth.
1) Installation Costs: We’ve already looked at average installation costs in the sections above, but keep in mind that actual solar costs can jump higher or lower depending on your area and installer. Costs tend to be higher in states like California with higher wages, permitting fees, and/or overhead. While NREL estimates the average installation cost is around $2.70 per watt, costs can jump to $3.00/watt or more in some areas. A $0.30 difference might not sound like a lot, but talking to a few different installers to find the cheapest rates can save you thousands right off the bat.
2) Electricity Production: Since you’ll be avoiding that high-priced electricity from the utility, the more solar energy you produce, the more you can save. The amount of electricity your installation produces is largely affected by your installation size and geographic location. For example, a 6kW installation in sunny Arizona will generate about 10,165 kilowatt-hours (kWh) of electricity in the first year, while that same installation in Minnesota will produce 7,993 kWh. That doesn’t mean installing solar in Minnesota is pointless, but rather that an Arizona homeowner will see a faster return on investment.
3) Utility Prices: Utility rates are one of the biggest factors when calculating the cost-effectiveness of your solar installation. Every kilowatt-hour of electricity your solar installation produces is a kilowatt-hour you don’t have to buy from the utility. With this in mind, if you live in California – where utilities charge $0.18 per kWh on average – you’ll recoup your solar investment much faster than if you live in Idaho, where the average utility rate is about $0.10 per kWh. Again, this doesn’t mean that installing solar in Idaho is worthless, just that California homeowners can see a faster return on their solar investment.
Utility rates are also rising each year as well – another major component in estimating your total lifetime savings. And of course the rate at which utilities raise rates varies widely. Over the last 15 years, utilities in the US have increased electricity prices by 2.6% each year on average. However, that ranged from 1.4% in Maine and Louisiana to 4.6% in Hawaii. The faster the increase, the more you can save by installing solar. Over the 25-year lifetime of your solar installation, the rate of increase can affect your total savings by thousands of dollars.
If all this sounds overwhelming, don’t worry about it! When you contact local solar installers for estimates, any solar installer worth their weight will lay out your utility’s current prices as well as its annual rate of increase.
4) Financing: Lastly, your financing also affects your savings. You’ll see the biggest financial return by paying for your installation in cash. But of course, your bank account will take a pretty big hit if you pay in cash. Thankfully, there are more options available.
As home solar has become more popular, more and more banks and credit unions are now offering low-interest loans specifically for solar installations. You can also take out a HELOC or Home Equity Loan to pay for your installation as well. Your total savings will be lower since you’ll be paying that pesky interest, but you won’t have to spend your nest egg either.
Solar leases are also available, but these usually lead to the lowest return on investment of all the solar financing options available and we really don’t recommend them.
There are even more factors than the four above that affect your solar savings. For example, financial incentives like the federal tax credit or utility rebates can increase your savings and it’s important to know your state’s net metering regulations as well. But the above four factors contribute heavily to your total solar savings.
Each solar installation is custom designed and built, so the best way to get an accurate estimate for your cost and savings is to simply reach out to a few solar installers. All solar companies – big and small – offer free estimates. Some companies even use online tools to remotely estimate your cost and savings, so they don’t even need to come to your home or set up an appointment.
If you live in an area where solar installations are a common site, chances are you can also save money by installing solar. While solar costs have plummeted over the last decade, that might not be the case anymore, as solar panel prices have bottomed out and financial incentives continue to dry up. With the federal Investment Tax Credit starting to phase out this year, if you’re thinking about going solar, it’s probably best to hit the gas within the next year or two.
Should I install solar now or wait?
Reading about the ever-falling costs of solar, you’re probably wondering whether you could see an even better return on your investment if you hold off on solar right now and wait a bit longer. After all, installation costs will surely fall even further in the next 5 to 10 years. Seems smart, right?
While solar panels could fall a bit further and solar installers will likely get more streamlined and efficient, it’s really a moot point. Save a dollar now or a dollar later, the best time to invest is right now – not tomorrow.
As of 2019, the average solar installation (with incentives) takes about 8 to 12 years to see a payback, though that depends on your utility’s prices and geographic location. With solar installations lasting about 25 years, that gives you about 13 to 17 years to reap the financial rewards of completely free clean energy.
For a bit more insight into payback periods, let’s return to our Colorado example above. The total investment is $12,600 (after the ITC) on an installation that produces about 9,600 kWh each year. With the average utility in Colorado charging $0.12 per kWh, you’re avoiding a $1,150 utility bill each year. At that rate, it would take you about 11 years to recoup that initial investment, leaving you 14 more years of zero-cost to enjoy. After 14 years of producing your own clean energy, you’ll have saved almost $23,000.