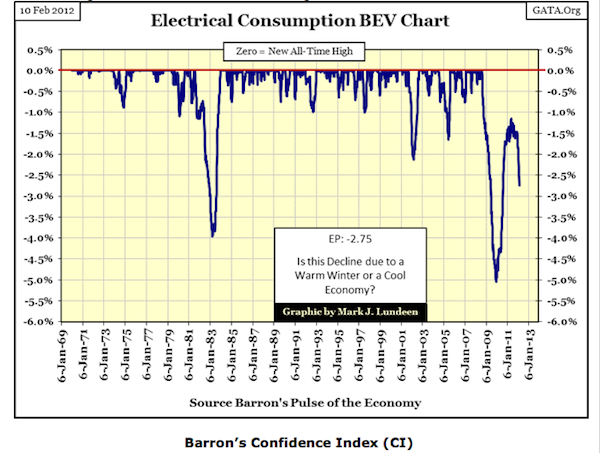
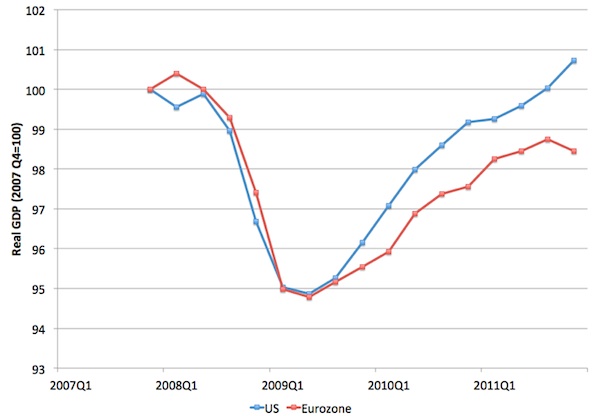
Investment advisors like Barron’s are apparently alarmed by a sudden drop in U.S. energy use, and believe that it indicates that our economy must now be in the deep freeze. Money guys—who always equate rise in GDP with rise in energy use—can imagine no other explanation for reduced energy use than that we are now experiencing economic doom, hiding in caves and struggling to work in wheelbarrows instead of our God-given SUVs.
Those of us who read green tech news, of course, know that decoupling energy use from GDP is the holy grail of an advanced low-carbon economy—that the world’s climate-conscious nations are striving to achieve. There’s even a pretty common name for it, “reducing energy intensity.”

For example, we read here how GM cut the energy intensity of its manufacturing plant 30 percednt or that globally, energy intensity has not dropped—mostly because developing nations tend not to do as well as already industrialized ones, and there’s more of them now, with China ramping up.
From 1989 – 2010, electric utility efficiency programs saved about 1,171 billion kilowatt-hours of electricity, saving enough to power 102 million average U.S. homes for one year (based on 2010 average residential usage of 11,500 kWh/year), according to the U.S. Department of Energy.
It is a given in climate policy circles that cutting the amount of energy used to generate a unit of GDP is a good thing—a target to aim for.
So it is a bit disconcerting (to this green reader, at least) to notice that this is not the typical view. We all dwell in such different walled information-ghettos that the same news means something completely different to others.
Yes, we went through a financial near-depression in 2008. But simultaneously, we had also begun serious climate policy in 2005 that has been yielding great energy news every day on green tech sites for the last four years. Some states began utility energy efficiency mandates as early as 1999, and ramped them up since.
By contrast with our satisfaction with stories of energy efficiency, among the money-centric, there is a hysterical reaction of alarm in response to news of the drop in energy use over the last few years, first fretted about by the Wall Street Journal during the financial shock of 2008. (Perhaps this visceral fear of less energy use is what is behind the antique lightbulb fetish of the Republican Congress?)

And even though now our GDP is now back up above 2008 levels, our energy use remains far below 2008 levels. How can that be?
Well, that’s what better building codes, utility efficiency improvements, tighter appliance efficiency advances and higher CAFE standards are all about.
One example of the electricity-saving policies electric utilities now use to meet state energy efficiency mandates is “demand response.” Because peak hours can take a lot of fossil fuel (and hence carbon emissions) to power up, utilities—in many of the states with climate policies that incentivize it—offer some of their big commercial customers a break on their utility bills if they allow the utility to cycle off their A/C, for example, for perhaps a minute every half hour during peak hours.
(Related: Data Shows Customer Demand for Demand Response Smart Grids)
By aggregating their demand-response customers into rolling blocks with brief energy cuts each, for so brief a moment as to be imperceptible at each site, utilities don’t need to fire up a peaker plant. Even many home energy users can be aggregated like this.
Nationwide over the last few years, utilities have been expanded energy efficiency efforts that began in 2007, so that in four years, the savings have grown by 80 percent. Each year energy use has actually been cut. It saves money. At between 3 and 5 cents a kilowatt-hour—it’s cheaper to save energy than make energy, even from coal.
According to the Institute for Electric Efficiency, the 2010 reduction alone cut 112 terawatt-hours (TWh) from U.S. energy use, a 3 percent cut in total U.S. electricity use of about 4,000 TWh a year. Every year it has been more, so 2011 will bring a bigger cut.
Ed Wisniewski, executive director of the Consortium for Energy Efficiency, says, “Over the four years since 2007, savings impacts have grown 80 percent, justifying the ramp-up of investment in efficiency that’s also occurred over this time period. This scale affords a unique opportunity to address the challenges ahead and reap the tremendous savings that are still available cost-effectively.”
Graphs of energy intensity like the one above, from National Energy Policy Institute’s Energy Forum Online for the U.S., now make a downward trajectory on energy use, whereas it used to keep rising year by year.
The graph of California’s electricity use provides a 40-year example. The state’s economy grew phenomenally from the 1970s till now, but its electricity use flatlined since the ’70s, the result of deliberate energy efficiency policy. Every other state’s growth in GDP was closely paralleled by its rise in energy use.
With climate an issue for policymakers (at least state-level) since around 2005, other states are following California’s example. Policies were put in place to cut greenhouse gases, including cutting energy intensity. And these policies work.

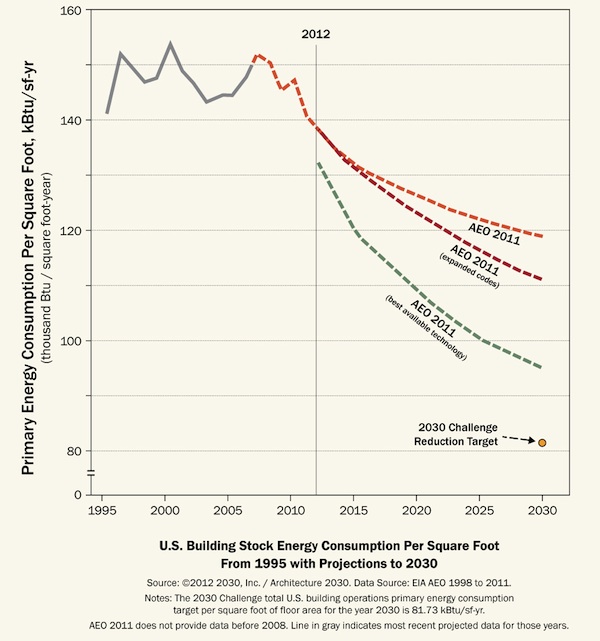
Architecture2030 also published evidence of the impressive drop in energy use in buildings (the orange line in the graph above) through better building codes in place since 2005, by way of urging us forward to yet more impressive gains for the future that will save Americans at least $3 trillion in energy bills till 2030, and $6 trillion with the further tightening of building codes they propose.
The EIA estimates of residential and commercial building energy use to 2030 have dropped dramatically since 2005—by nearly 70 percent —due to improved energy efficiency in buildings. Similar gains have been made in other areas in reducing energy use, as stories here attest every day.
Readers here are not surprised to read of houses that use no energy or this month’s Ceres rankings of utilities for efficiency.
We read of consumers who now demand discounts if they are energy efficient in states that have long charged you more if you use less energy—a truly perverse incentive (and an odd idea to someone from California which has had the opposite incentive in policy since the 1970s.)
But if you didn’t routinely ingest energy news on greentech sites like Earthtechling, the startling effect of these kinds of graphs of news of energy drops must look alarming, like a warning of danger.
To money guys, all graphs are supposed to go up – not down! But it’s not the evidence of catastrophe they think.
It’s a feature; not a bug.