Renewable energy capacity worldwide is at an all-time high of 2,351 GW, just over a third of the world’s total electricity capacity.
According to a new report from the International Renewable Energy Agency, total renewable energy capacity grew from 2,127 GW in 2017 to 2,350 GW in 2018, a 10% increase over the previous year – in line with previous yearly growth. That number includes solar and wind, but also hydropower, biofuels, and geothermal.
Solar and wind energy made up the majority of that growth, accounting for 64%. Of that, solar led the way with a record-breaking year, as 94 GW of solar were added in 2018. And while wind still beats solar in total capacity, only 49 GW of new wind resources came online last year –half of the amount of new solar.
However, despite the growth in solar and wind resources, the most popular renewable resource worldwide remains hydroelectric, which at 2,350 GW of capacity makes up about 55% of the world’s total renewable energy. Here’s how total renewable capacity breaks down in 2018:
Worldwide Renewable Energy Capacity in 2018
- Hydroelectric: 1,292 GW
- Wind: 564 GW
- Solar: 486 GW
- Total renewable energy: 2,351 GW
- Total energy capacity (both renewable and fossil fuel): 6,473 GW
While wind still beats solar in total capacity, solar energy has been working hard to catch up over the last decade. Back in 2009, total worldwide solar energy was just 23 GW, while wind came in at 150 GW. As you can see above, fast forward to 2018 and solar’s closing in on that gap.
Solar and wind replace coal in US
Renewable energy is on the rise across the globe, as clean energy continues to both replace existing fossil fuel plants and cover a portion of new energy demand.
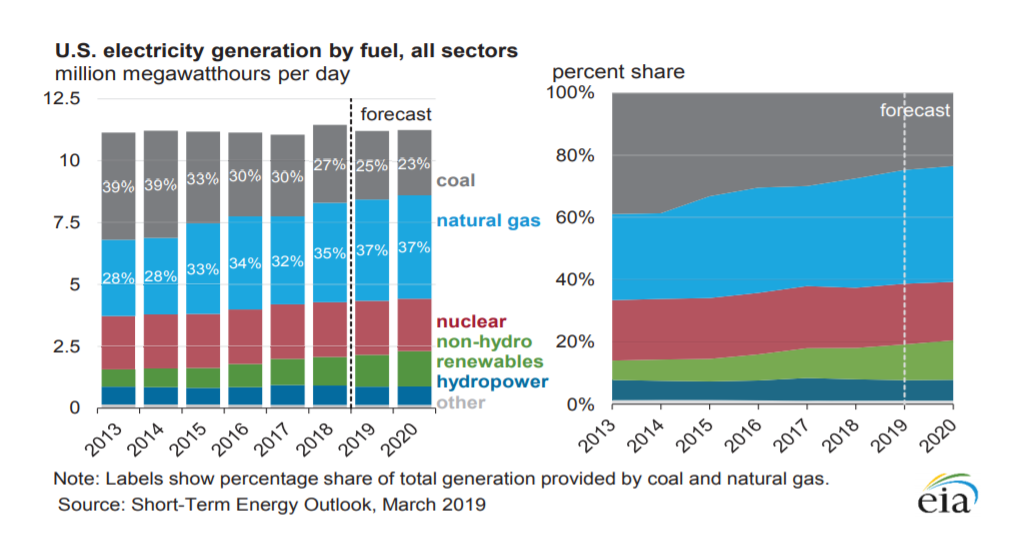
In the US, renewable energy (excluding hydro) increased from 4% of all energy in 2010 to 10% in 2018, according to the EIA’s March 2018 Short-term Energy Outlook. The EIA expects that number to continuing climbing to 13% by 2020. In comparison, coal continues to fall, as older plants are retired and renewable energy continues to become more cost-effective. Coal fell from 45% of all generation in 2010 to about 27% in 2018, and is expected to further fall to 23% in 2020.
Even with this growth in renewable generation, fossil fuels still dominate the electricity industry, dominated mostly by cheap natural gas. Unlike coal, which utilities are phasing out for cost reasons, natural gas is cheap and makes up an ever-growing percentage of energy in the US, from 24% in 2010 to an estimated 37% in 2020.
Here’s how our electricity generation mix breaks down:
Natural gas is certainly a cleaner fuel source than coal – it produces about half the CO2 emissions during generation – but it’s still a finite resource and, obviously, still produces emissions. The DOE estimates that for every 10,000 homes that are powered by natural gas instead of coal, we avoid:
- 1,900 tons of nitrogen oxide emissions
- 3,900 tons of Sulphur dioxide emissions
- 5,200 tons of particulates
All of these pollutants are linked to respiratory issues like asthma and bronchitis, so while natural gas is certainly more environmentally-friendly than coal, it’s not an end-all-be-all solution for energy generation. It’s kind of like taking a hard class and going from an F- to a D+. It’s better, but still not a passing grade.
Renewable energy driven by market realities and policy
Uptake in renewable energy over the last decade has been driven by two key factors: the drastically falling price of renewable technology and good policy on the state and federal level to drive adoption.
Each year, analysis company Lazard analyzes and compares the levelized cost of energy (LCOE, which takes into account construction costs, fuel, and O&M costs) of both renewable and conventional fuels. In their latest 2018 report, they found that renewable energy is continuing to fall to the point where it is at or below the cost of conventional generation. Onshore wind turbines are the cheapest form of electricity generation, followed closely by utility-scale PV solar, then natural gas, then coal:
- Onshore wind: $29 to $56 per MWh
- Utility-scale PV solar: $36 to $44 per MWh
- Natural Gas: $41 to $74 per MWh
- Coal: $60 to $143 per MWh
Utilities are finding that, as old natural gas and coal-fired power plants near retirement, it actually makes financial sense to replace them with wind or solar.
Utilities are even seeing solar and battery storage as a cheaper alternative to the gas peaking plants used during times of peak demand. Because of the unique challenges that gas peaking plants must overcome (fast ramp-up with little warning), these plants are much more expensive to run than other sources of electricity – about 2x to 6x more than a typical natural gas plant, according to Lazard.
Case in point: Florida utility FPL just announced in April that it’s planning to replace two 70s-era coal plants with a 409 MWh battery pack – the largest utility battery project in the world. FPL will pair the batteries to an existing solar farm and store the energy for use during those times of peak demand.
Distributed roof-top PV solar still remains more expensive than the generation sources above. However, that doesn’t mean it can’t offer homeowners and businesses financial savings. Quite the opposite in fact, as the utility’s final price for end users also takes on infrastructure costs, operating costs, profit that customers can successfully avoid, at least partially, by installing roof-top solar.
Pro-renewables policy is also a key driver to renewable energy uptake. Seeing the benefits of solar and wind energy – low cost, energy independence, and no emissions – governments have taken a multi-prong approach to encourage adoption among homeowners and businesses, including:
- Renewable portfolio standards: Twenty-nine states have adopted RPSs, which force utilities to source a certain percentage of their electricity generation from renewable sources. To meet these goals, utilities are typically allowed to generate their own renewable energy, purchase renewable energy from privately-owned power plants, or collect Renewable Energy Certificates from companies or their own customers.
- Utility Rebates: When homeowners give their RECs to the utility to meet the RPS goals, utilities typically give homeowners either a flat rebate or a performance-based incentive as payment. These rebates help homeowners jump that cost hurdle to installing solar.
- Tax incentives:Federal and state governments offer income tax credits for solar installations, sales tax exemptions for equipment and labor costs, and property tax exemptions for the additional value solar brings to a home. All of these incentives are designed to lower the financial hurdle to install solar, wind, or another renewable resource.
Not coincidentally, most of these policies have been in place for the last decade, as the solar industry has exploded in size. The policies are certainly working, as you can see in our changing generation mix.
As we move into the next decade, more and more of these incentives are falling off, as solar adoption reaches a point where the market can sustain itself. While some in the solar industry are bemoaning that day, it’ll likely work exactly as planned: the solar industry will be at a point where it can sustain itself, without the help of incentives or rebates.
Image Source: Public Domain via Pexels