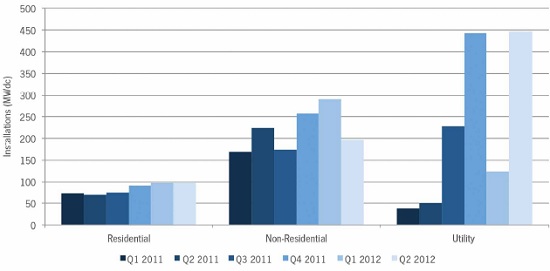
A big second quarter for solar installations – up 45 percent over the first quarter and 116 percent higher than in the second quarter of 2011 – puts into sharp focus the bifurcation of the U.S. industry, as installed capacity continues to surge ahead while the manufacturing sector retrenches. But there was another, emerging storyline in the data: The hefty increase in installations was driven primarily by a boom in utility-scale developments; the residential sector was flat and commercial installations dropped significantly.
The Solar Energy Industries Association said 742 megawatts were installed in the April-June quarter, bringing the U.S. to a 1,259.7 MW total for the first half of the year – a 102 percent increase over the 622.7 installed in the first half of 2011. At the same time, wafer, cell and module production were all off between a quarter and a third, the report said, as manufacturers shut down or trimmed output.

“With costs continuing to come down, solar is affordable today for more homes, businesses, utilities, and the military,” Rhone Resch, SEIA’s president and CEO, said in a statement. “Smart, consistent, long‐term policy is driving the innovation and investment that’s making solar a larger share of our overall energy mix.”
The fall in the price of solar panels has been huge – from $1.56 per watt in the second quarter of 2011 to $0.87/W in Q2 2012, a 44 percent decline. Not even preliminary duties on Chinese solar PV products has slowed the decline. “Thus far, module pricing does not appear to be materially affected by antidumping tariffs on modules containing Chinese cells, even though tolling cells through Taiwan does impose a slight cost increase on manufacturers,” the report said.
The ever-lower prices for modules have helped drive down the installed cost of solar. For residential systems, prices have gone from nearly $7 per installed watt at the beginning of 2010 to $5.46 in the most recent quarter. That equates to a $7,500 savings on a typical 5-kilowatt home system. Utility system prices have dropped even more steeply, down 33 percent in the past year alone, to $2.60 per installed watt.
And it was utility-scale projects that carried the bulk of the load in the second quarter, according to the new report, with 447 MW or 60 percent of the quarter’s total. That was the biggest quarter ever for utility-scale solar. In fact, without this spike, solar installations were surprisingly soft given the falling prices for systems.
Residential installations were essentially flat, up just one megawatt to 98.1 MW, while the non-residential market — these are systems on warehouses and other businesses — fell from 291 MW in the first quarter of 2012 to 196 MW. “Although California (down 45 percent) and New Jersey (down 35 percent) contributed a large part of the decline, these states were not alone,” the report said.
One other notable development highlighted in the report: the rise of the third-party ownership model – in the West in particular. More than 70 percent of residential installations in each of California, Arizona and California were third-party owned (that is, lease or power purchase agreement).

“The success of third party residential solar providers has attracted more than $600 million in new investments in recent months,” said Shayle Kann, vice president of research at GTM Research. “This influx of cash into the residential space signifies the growing acceptance of solar leases and power purchase agreements as a secure investment for project investors.”
Yet the trend toward third-party ownership of systems hasn’t actually helped to grow residential installations. “To date this model has not expanded the overall market, but rather taken market share from direct ownership,” the report said.