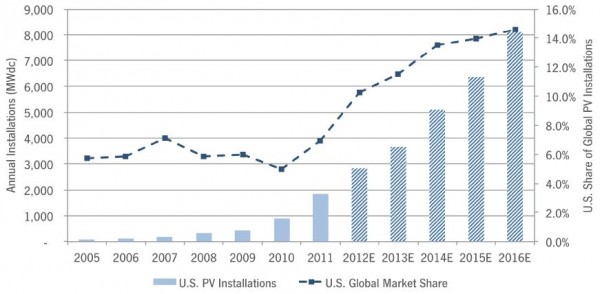
Falling prices for solar panels and the looming expiration of a federal tax provision drove U.S. photovoltaic (PV) solar installations to record levels in 2011. From home rooftops to business warehouses to utility-scale power plants, installations totaled 1,855 megawatts (MW) in 2011, more than double the previous mark of 887 MW, set the year before, the trade group Solar Energy Industries Association (SEIA) and GTM Research said today.
Activity was especially furious in the fourth quarter of the year, when 755 MW were installed. Many investors were racing to commission projects before the anticipated expiration of the U.S. government’s 1603 Treasury Program, which ended Dec. 31, 2011, the report said.

The 1603 program allowed renewable energy developers to receive a grant for up to 30 percent of the cost of a project in lieu of claiming an energy tax credit, but despite intense industry lobbying, Congress wouldn’t bite on extending the grants into 2012 and beyond.
That could put a bit of crimp into growth this year, although other subsidies and, perhaps most importantly, falling prices remain as big incentives. They were a huge factor in 2011, when, according to the SEIA, growth “was spurred in part by declining installed solar photovoltaic (PV) system prices, which fell 20 percent last year on the back of lower component costs.”

Taking it all into consideration, the report forecast installation of more than 2,800 MW in 2012—a 50 percent annual growth rate, down significantly from the 109 percent growth the industry saw in 2011. Still, 2,800 MW is a huge number considering that at the end of 2011, cumulative installed PV capacity in the U.S. was at 3,954 MW. “Beyond 2012, the report forecasts installations to continue their ascendancy at a compound annual growth rate of 30 percent through 2016,” the SEIA said.
Some 800 of the 1,855 MW installed in 2011 were in the commercial sector, followed by 758 MW in utility PV and 297 MW in residential installations. The jump in utility-scale installations was especially notable, tripling in 2010 as big projects got going in the Southwest.
“In 2011, the market demonstrated why the U.S. is becoming a center of attention for global solar,” Shayle Kann, managing director of GTM Research’s solar practice, said in a statement. “It was the first year with meaningful volumes of large-scale PV installations; there were 28 individual PV projects over 10 megawatts in 2011, up from only two in 2009. Furthermore, the market continued to diversify nationally; eight states installed more than 50 megawatts of solar each last year, compared to just five in 2010. These are all indicators of a vibrant market.”

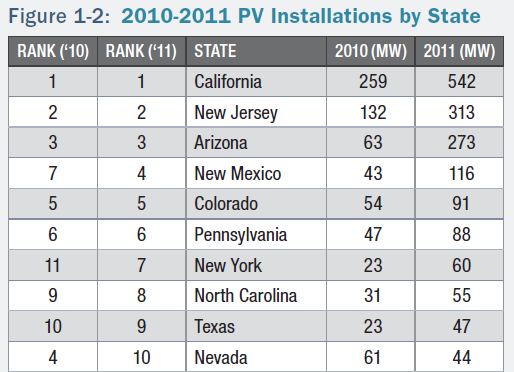
California, as usual, led the way in new solar PV, with 542 MW of capacity installed in 2011, with New Jersey (313 MW), Arizona (273 MW), New Mexico (116 MW), Colorado (91 MW), Pennsylvania (88 MW), New York (60 MW), North Carolina (55 MW), Texas (47 MW) and Nevada (44 MW) rounding out the top 10. In all, the report said, there were more than 61,000 PV systems installed in the U.S. in 2011, pushing the nation’s total to around 214,000.
On the manufacturing front, the data showed a U.S. industry in realignment. While installations increased dramatically, domestic and global demand didn’t keep pace with the huge increase in production capacity the industry experienced in 2010, leading to retrenchment among producers. The report said that in 2011 the U.S. produced 40,658 metric tons of polysilicon, 384 MW of wafers, 969 MW of cells, 1,219 MW of modules and 1,653 MW of inverters—flat compared to 2010 for polysilicon and modules, and down significantly on wafers and cells.
The report said 68 percent of the modules produced in the U.S. in 2011 were crystalline silicon, with cadmium telluride (23%) and CIGS (7%) the only other real contributors. Thin-film made up just a shade under one-third of production, “but this is expected to increase over the course of 2012 and 2013 as numerous thin fi lm facilities come on-line and ramp up production,” the report said.
The executive summary of the report is available online.